Diversity in public media is getting a lot of attention these days, so with the advent of the new census data, we’d thought we’d do a comparison of how public media compares to the growth in the diversity of the U.S. population overall.
The diversity of the United States has changed considerably over the past decade based on recently released data from the 2020 census. We also know that public media’s workforce has become more diverse in recent years thanks to data collected by the Corporation for Public Broadcasting (CPB) and as reported on in Current. But how do the trends compare, and is public media making as much progress as it would like?
What happened over the past decade: The public radio and television station workforce became slightly more diverse between 2011 and 2020, with the number of non-white people employed at stations growing by nearly 6 percent and the number of white employees declining by 2.4 percent (see chart below).
Percent Change in Public Radio & TV Station Employees (2011-20)

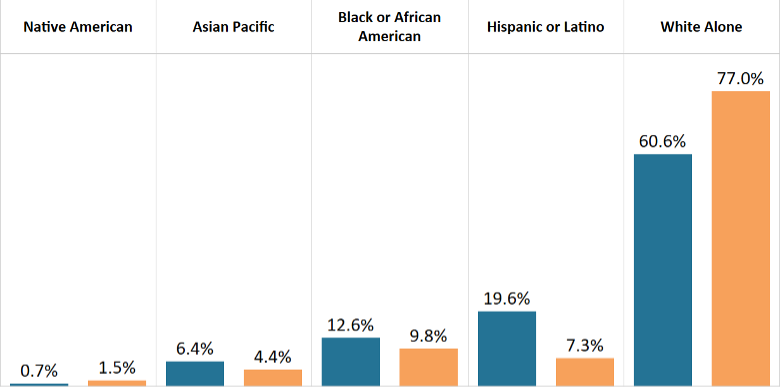
The bigger picture: Although the diversity of public media employees has grown over the past decade, the public media workforce is far from reflective of the United States’ overall population. In 2020, the country was 60.6 percent white, but, in contrast, 77 percent of employees at public radio and TV stations were white.
Looking at the data more discretely, public media is less diverse than the broader U.S. population in each major race/ethnicity. The gap for Hispanic or Latinx people is particularly pronounced – Latinx populations make up 19.6% of America but just 7.3% of public media employees.
Percent of U.S. Population or Public Media Workforce by Race/Ethnicity (2020)

Go deeper: The data also suggests that public media may be losing ground in its efforts to become a more diverse workplace – with the rate of change taking place in America’s racial and ethnic makeup outpacing the changes happening at stations around the country.
For example, the Asian Pacific population of the United States grew by 35% between 2010 and 2020, but the number of Asian public media employees increased by just 21% over a similar period. More concerning, the number of African American public media employees declined (down -2.8%) in recent years, during which time the African American population in the U.S. grew by 6.0%.
Percent Change in the Number of People by Race/Ethnicity

Worth noting: It’s important to mention a couple of caveats to this analysis. First, there is one year of difference between the CPB and census data – the CPB data begins in 2011 and the census data in 2010, so the growth rates are not a direct comparison. Also, the Census Bureau has reported that it made some improvements to its race/ethnicity data between 2010 and 2020. This may be influencing some of the data differences between the census years.
Also worth mentioning is that the census data reflects everyone in the country, including people of all ages and education levels. The U.S. population is more diverse in younger age groups, especially children, and so the American workforce is likely less diverse than the numbers highlighted in this post. Also, public media tends to require that employees have 4-year college degrees and educational attainment varies considerably by race/ethnicity. Although certainly not unique to public media, the restrictions we put on joining the workforce (bachelor’s degrees, relevant internships (that are often unpaid or poorly paid), etc.) likely impede the gateway to public media for people from diverse communities and low-income backgrounds.
The final word: Even taking the caveats into consideration, growth in employee diversity appears to be slow, and there is still work needed to ensure that the public media workforce reflects all Americans.


